Learning Objectives
After completing this lesson, you’ll be able to:
- Use feature debugging to run a workspace feature-by-feature.
- Use feature debugging to understand the flow of features through a workspace.
Resources
- Starting workspace
- C:\FMEData\Workspaces\UseDataIntegrationBestPractices\exercise-investigate-problems-step-by-step-with-feature-debugging.fmw
- Complete workspace
- C:\FMEData\Workspaces\UseDataIntegrationBestPractices\exercise-investigate-problems-step-by-step-with-feature-debugging-complete.fmw
- Addresses.gdb.zip
- C:\FMEData\Data\Addresses\Addresses.gdb.zip
- Parks.zip
- C:\FMEData\Data\Parks.zip
- Crime.csv
- C:\FMEData\Data\Emergency\Crime.csv
- leisure.osm
- C:\FMEData\Data\OpenStreetMap\leisure.osm
- PlanningRestrictions.gpkg
- C:\FMEData\Data\Planning\PlanningRestrictions.gpkg
Feature Debugging
Feature Debugging is a tool that allows you to inspect individual features during a translation. It differs from inspecting an entire dataset or a feature cache in that it inspects features individually and enables the author to trace that feature's progress through a workspace.
This tool is most useful when you have identified a problem occurring during transformation, but the point of failure is unknown.

Feature debugging functionality overlaps with feature caching. To a large extent, feature caching has replaced the need for feature debugging. But there are still some scenarios where you might want to use feature debugging. Sometimes, it can be helpful to follow an individual feature all the way through a workspace or to step through features individually to look for important differences. This procedure can also help you identify performance issues by observing where features encounter blocking transformers.
Because feature debugging allows you to inspect one feature at a time, it can also be faster than inspecting caches when your caches are very large. However, you can use a Sampler in those cases if you prefer caching.
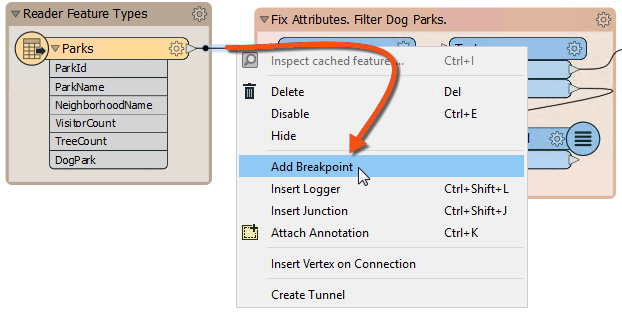
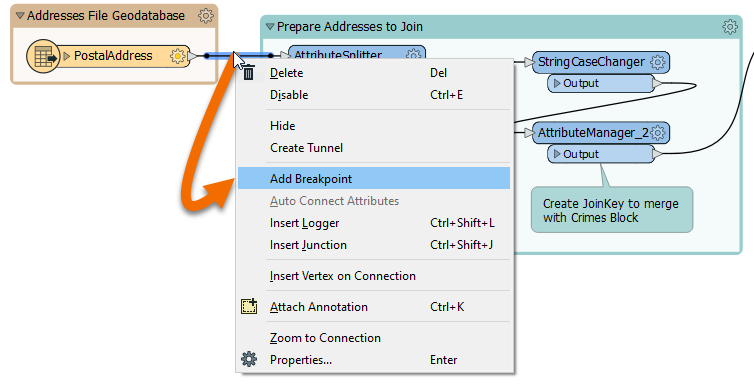
Feature Debugging is triggered by "breakpoints," workspace connections that the user flags as a location where they wish to inspect features:
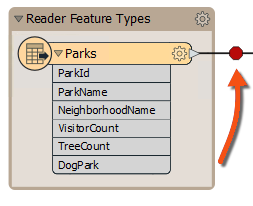
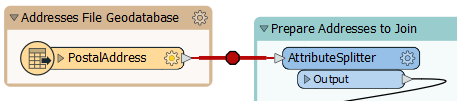
The connection is highlighted in a darker black color with a red "stop" sign to denote its new status:
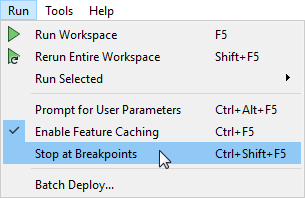
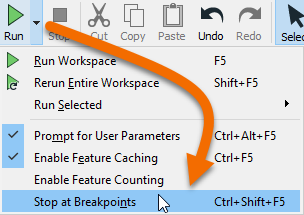
Now enable Run > Stop at Breakpoints and then run the translation:
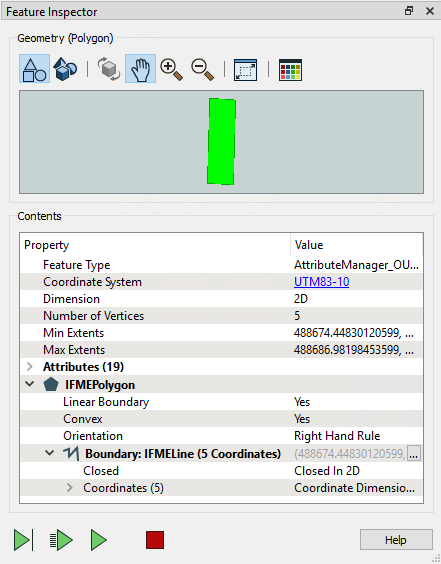
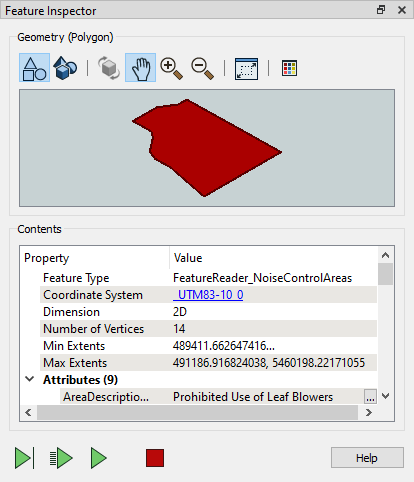
When the first feature arrives at the breakpoint, FME temporarily pauses the translation and displays information about the feature in a Feature Inspector window.
The upper section of the window shows a graphic representation of the feature; the lower section lists properties such as Feature Type and Coordinate System, plus attribute and geometry information.
There are four buttons at the foot of the Feature Inspector window:
|
Button
|
Operation
|
Description
|
|

|
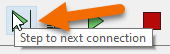
Step to Next Connection
|
This tool steps through the workspace one feature at a time, showing a feature's status as it is processed.
|
|

|
Step to Next Breakpoint
|
This tool re-starts the translation, stopping the next time a feature reaches an inspection point.
|
|

|
Continue Translation
|
This tool re-starts the translation, ignoring all further breakpoints.
|
|

|
Stop Translation
|
This tool stops the translation.
|
The active connection has a red highlight to show where FME paused the translation.
Exercise
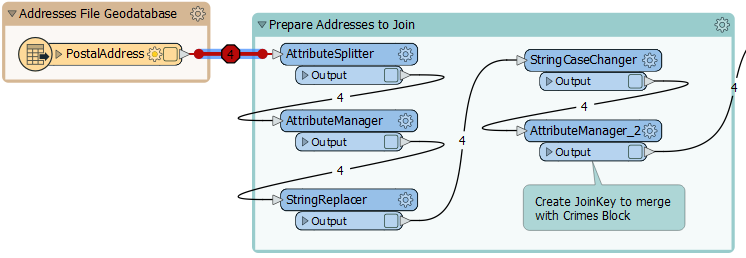
Open the starting workspace in FME Workbench (2023.1 or later). Right-click the connection line directly after the PostalAddress feature type and click Add Breakpoint.
Click the Run menu > Stop at Breakpoints, then click Run.
The PostalAddress reader starts to read in features but hits the breakpoint and stops. You can inspect the first address in the Feature Inspector window. It doesn’t have any geometry, but you can inspect its attributes.
 Click the Step to next connection button.
Your view of the canvas will shift to the Creator transformer as it creates its first feature. Click the Step to next connection button again. The FeatureReader reads one feature, and the Feature Inspector window displays it:
Click the Step to next connection button several times to read the three noise control areas. Eventually, your view will return to the address feature and follow it through connections. Eventually, the address features will stop at a particular transformer, and the active connection will return to reading more addresses. Please pay attention to where they stop. You will need the answer for this lesson’s quiz!
Although it’s not necessarily required in this workspace, being able to read a single feature at a time can help you debug. Note how this method lets you observe the order in which data is read and processed in a way that is difficult to do when the entire workspace is running.